Run Test in Stratos™ Studio
View Report
For the completed test run you can see:
- Summary Data
- Failures and Errors Details
- All Test Details
- Feature Breakdown Details
- Performance Details
- Location Details
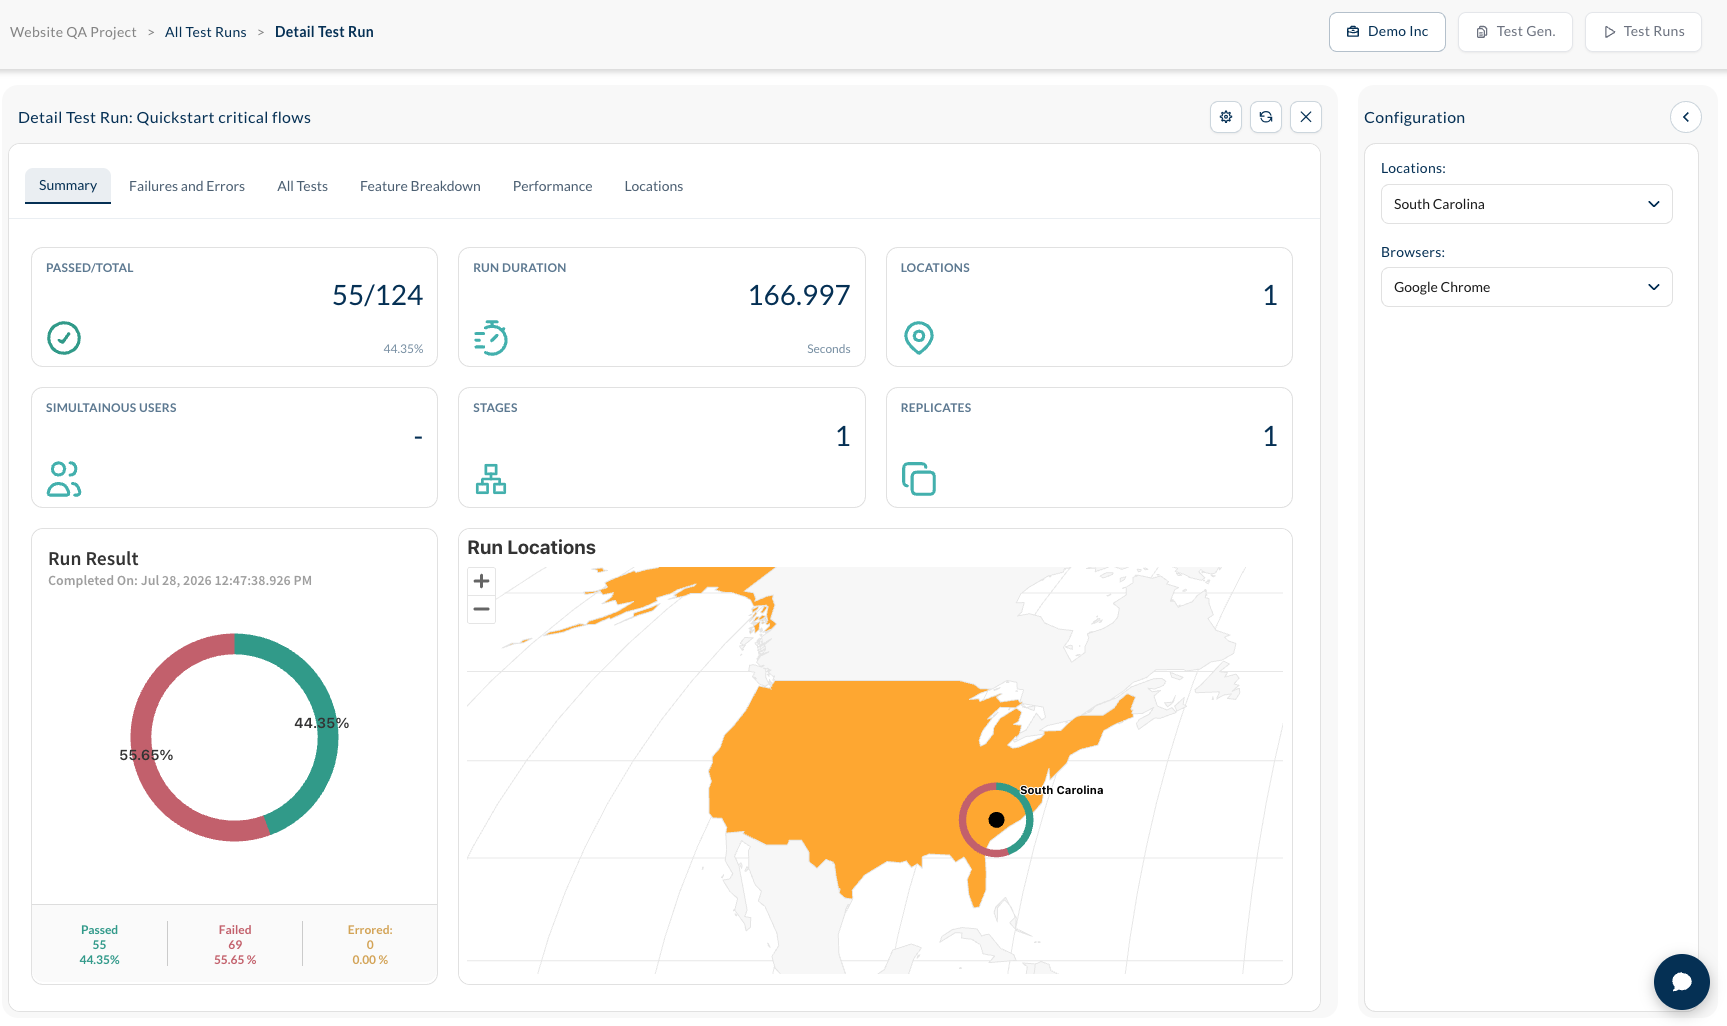
Summary Data Panel
For the completed test run you can see:
- Passed test count
- Total test count
- Failed test count
- Error test count
- % success rate
- Run duration in seconds.
- Run completion Date and Time
- Locations used to run the test
- Number of simultaneous users
- Number of stages
- Number of replicates
- A map of the United States indicating where the tests was run.
- A pie chart for each location showing the status of tests run at that location
- Number of users on average
- Average response time
- Median response time
- Maximum response time
- Run time
For this panel you can configure the following data filters:
- Locations
- Browser
Failures and Errors Panel
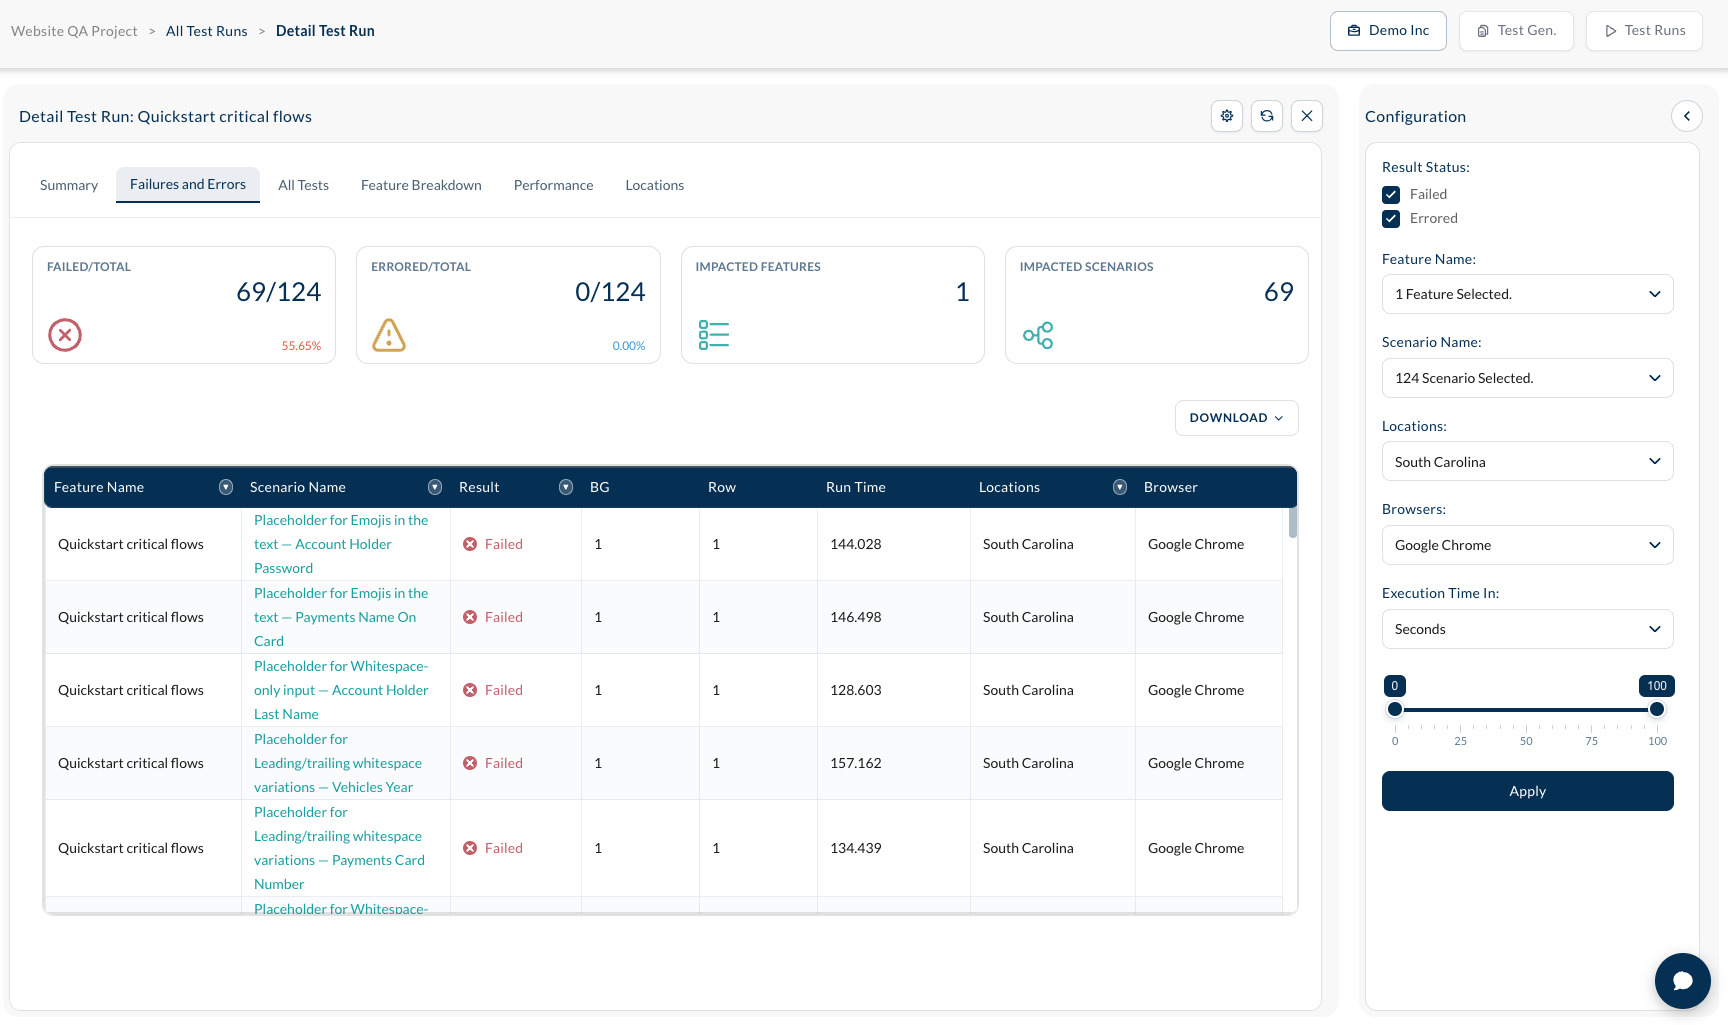
Metrics shown
- Failed Tests
- Errored Tests
- Features impacted by failures/error
- Scenarios impacted by failures/errors
For this panel you can configure the following data filters:
- Result status (Failed, Errored)
- Feature name and scenario name
- Location
- Browser
- Execution time units and a time‑range slider (0 to 36,011 seconds)
These filters help narrow down problem areas.
All Tests Panel
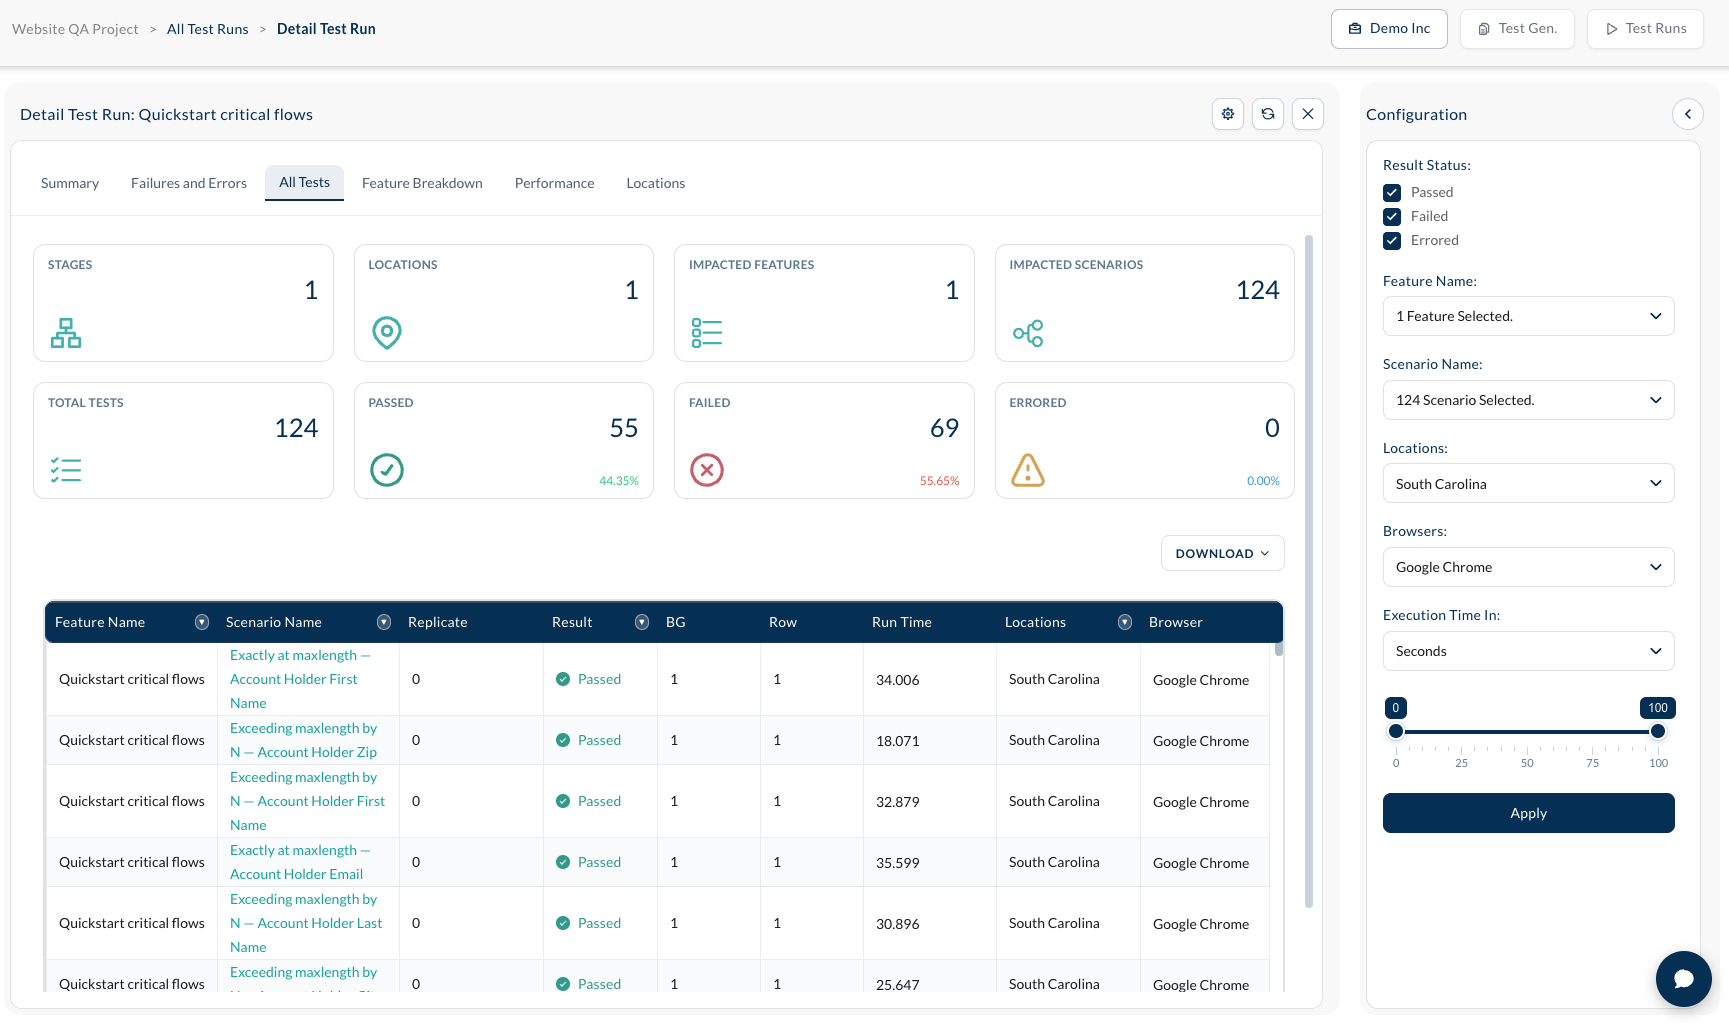
Captures the All Tests view of a test run including"
- Total tests
- Passed tests
- Failed / Errored tests
- Impacted features
- Impacted scenarios
- Number of Stages
- Number of Locations
The table lists the features tested
- Feature Name
- Scenario Name
- Number of Replicates
- Results of run tests
- Run Time
- Location
For this panel you can configure the following data filters:
- Result status (Passed, Failed, Errored)
- Feature name and scenario name
- Location
- Browser
- Execution time units and a time‑range slider (0 to 36,011 seconds)
These filters help narrow down problem areas.
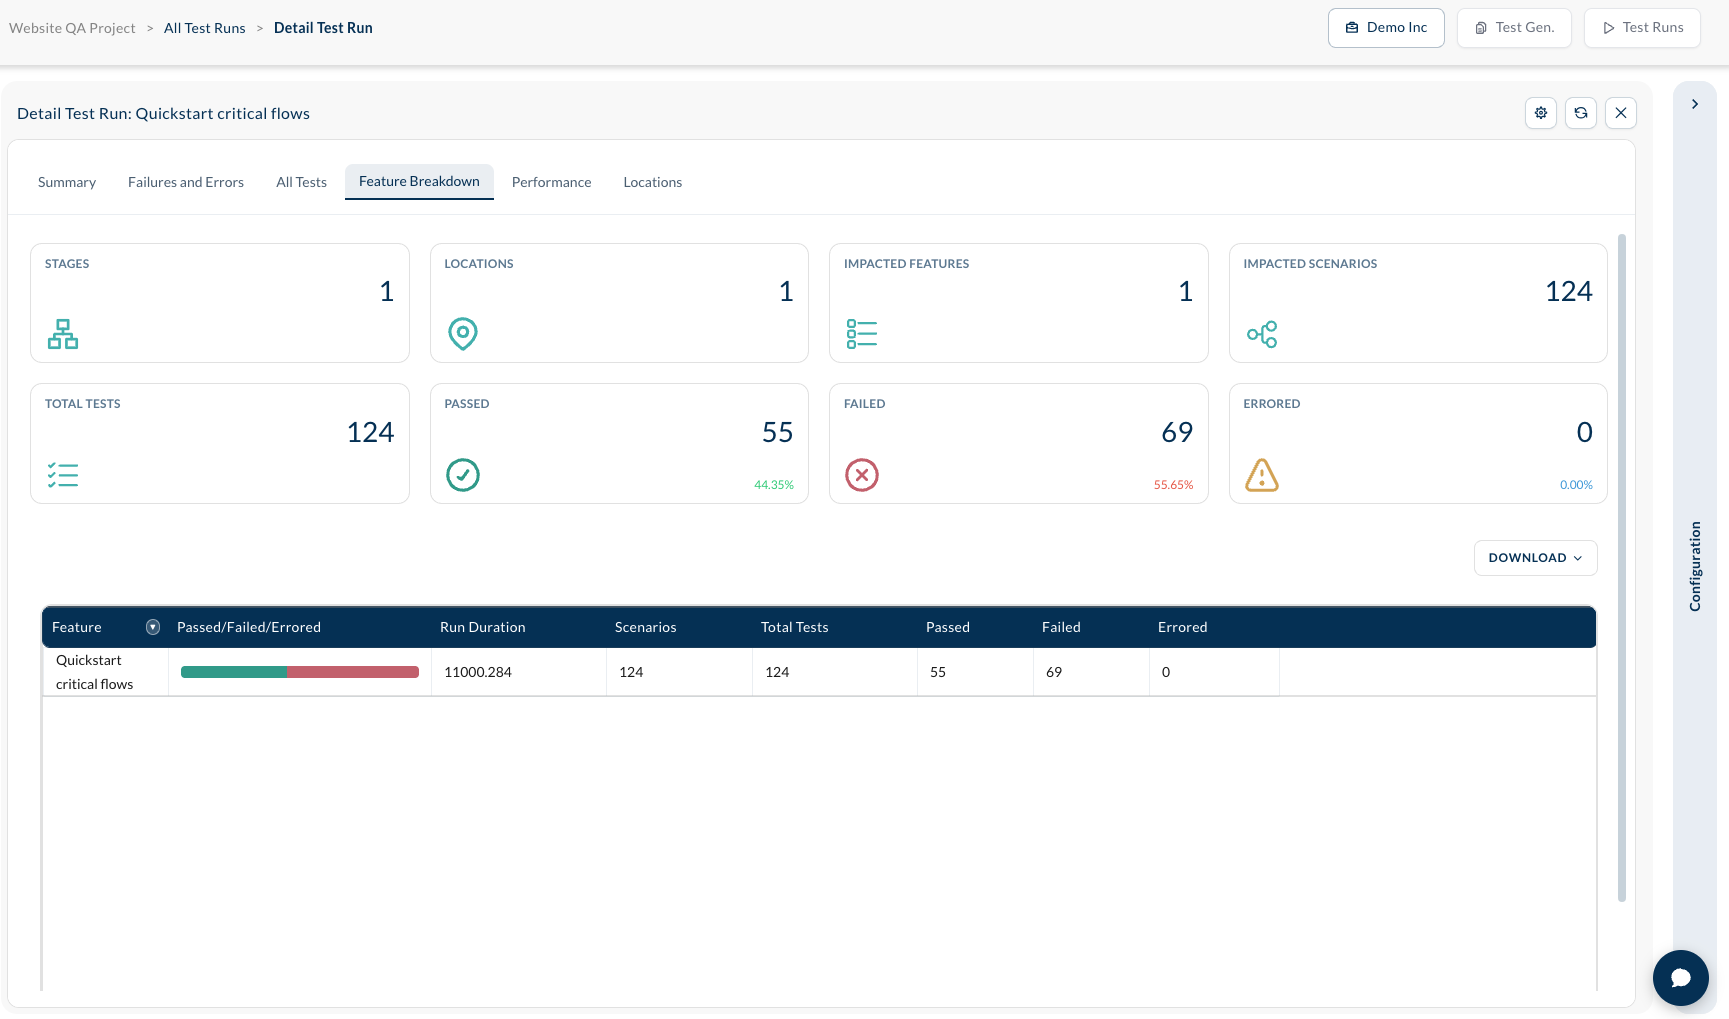
Feature Breakdown Panel
Captures the Feature view of a test run including:
- Total tests
- Passed tests
- Failed / Errored tests
- Impacted features
- Impacted scenarios
- Number of Stages
- Number of Locations
The table lists the features tested
- Feature Name
- Results of run tests
- Run Duration
- Number of Scenarions
- #Tests
- #Passed
- #Failed
- #Errored
For this panel you can configure the following data filters:
- Result status (Passed, Failed, Errored)
- Feature name and scenario name
- Location
- Browser
- Execution time units and a time‑range slider (0 to 36,011 seconds)
These filters help narrow down problem areas.
Performance Details Panel
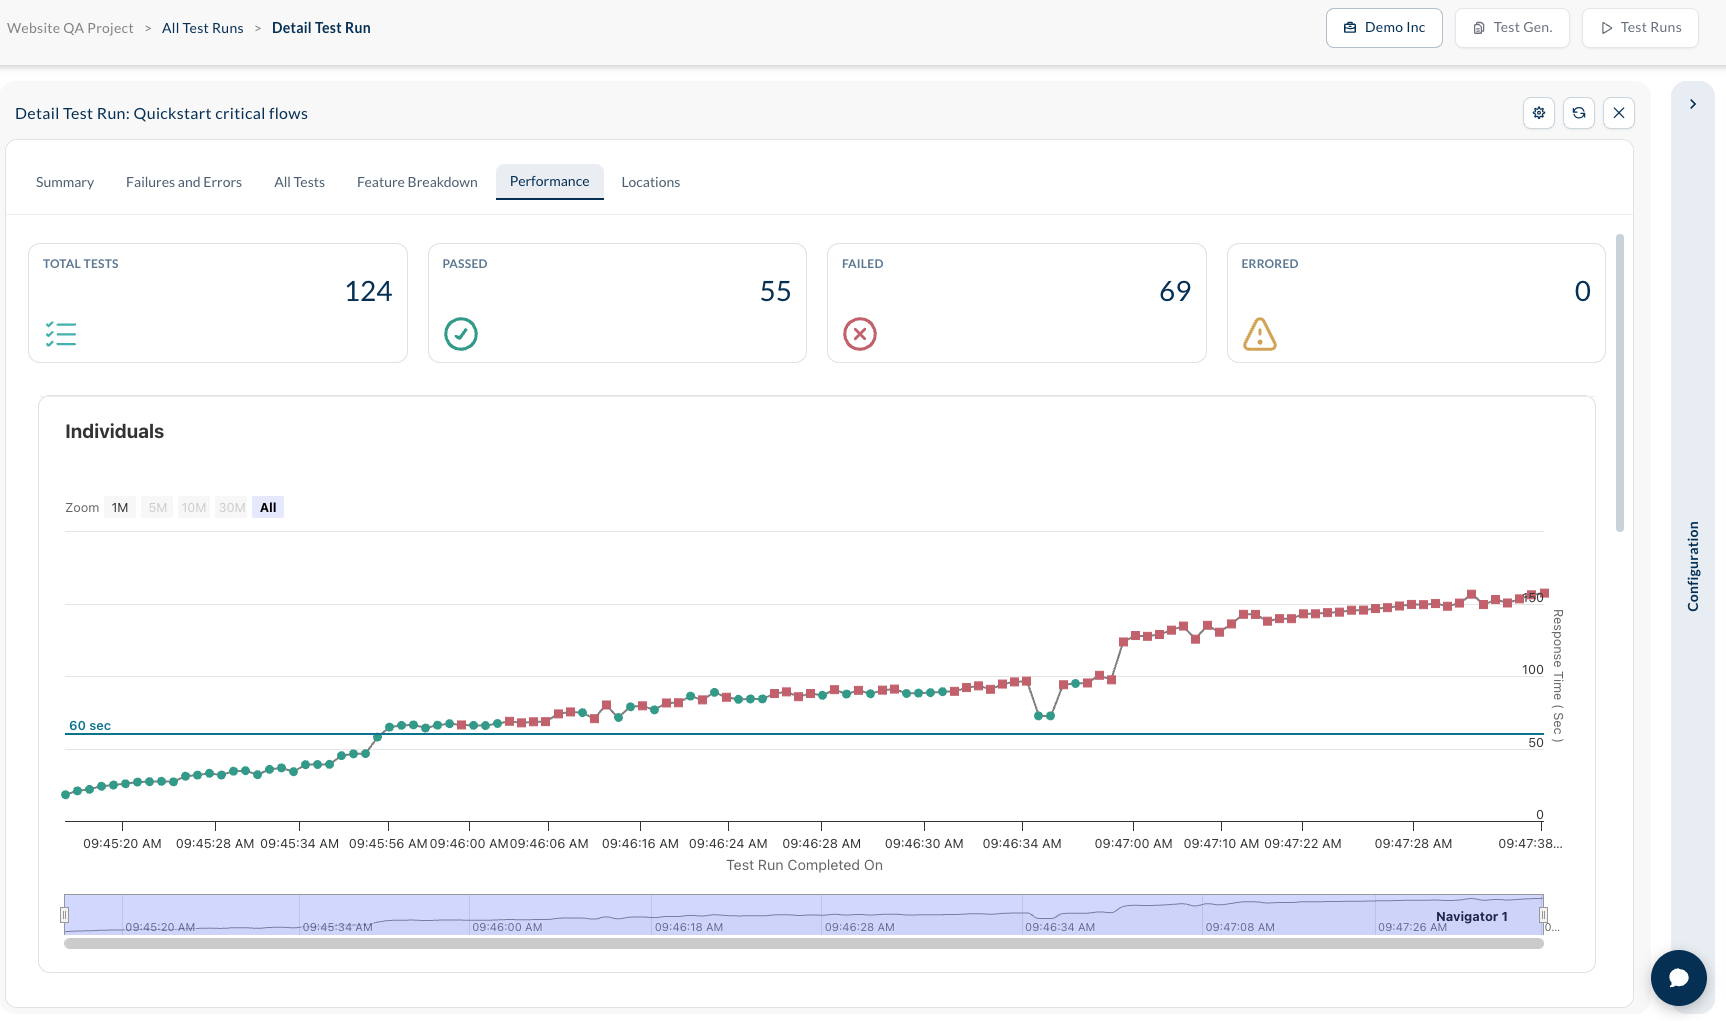
Captures the Performance view of a test run including:
- Total tests
- #Passed
- #Failed
- #Errored
- Plot of response time of tests for each test run.
- Pareto of response times
The table lists the features tested
- Completion date/time
- Feature Name
- Scenario Name
- Results of run tests
- Response time
- Location
For this panel you can configure the following data filters:
- Feature name and scenario name
- Location
- Browser
- Execution time units and a time‑range slider (0 to 36,011 seconds)
These filters help narrow down problem areas.
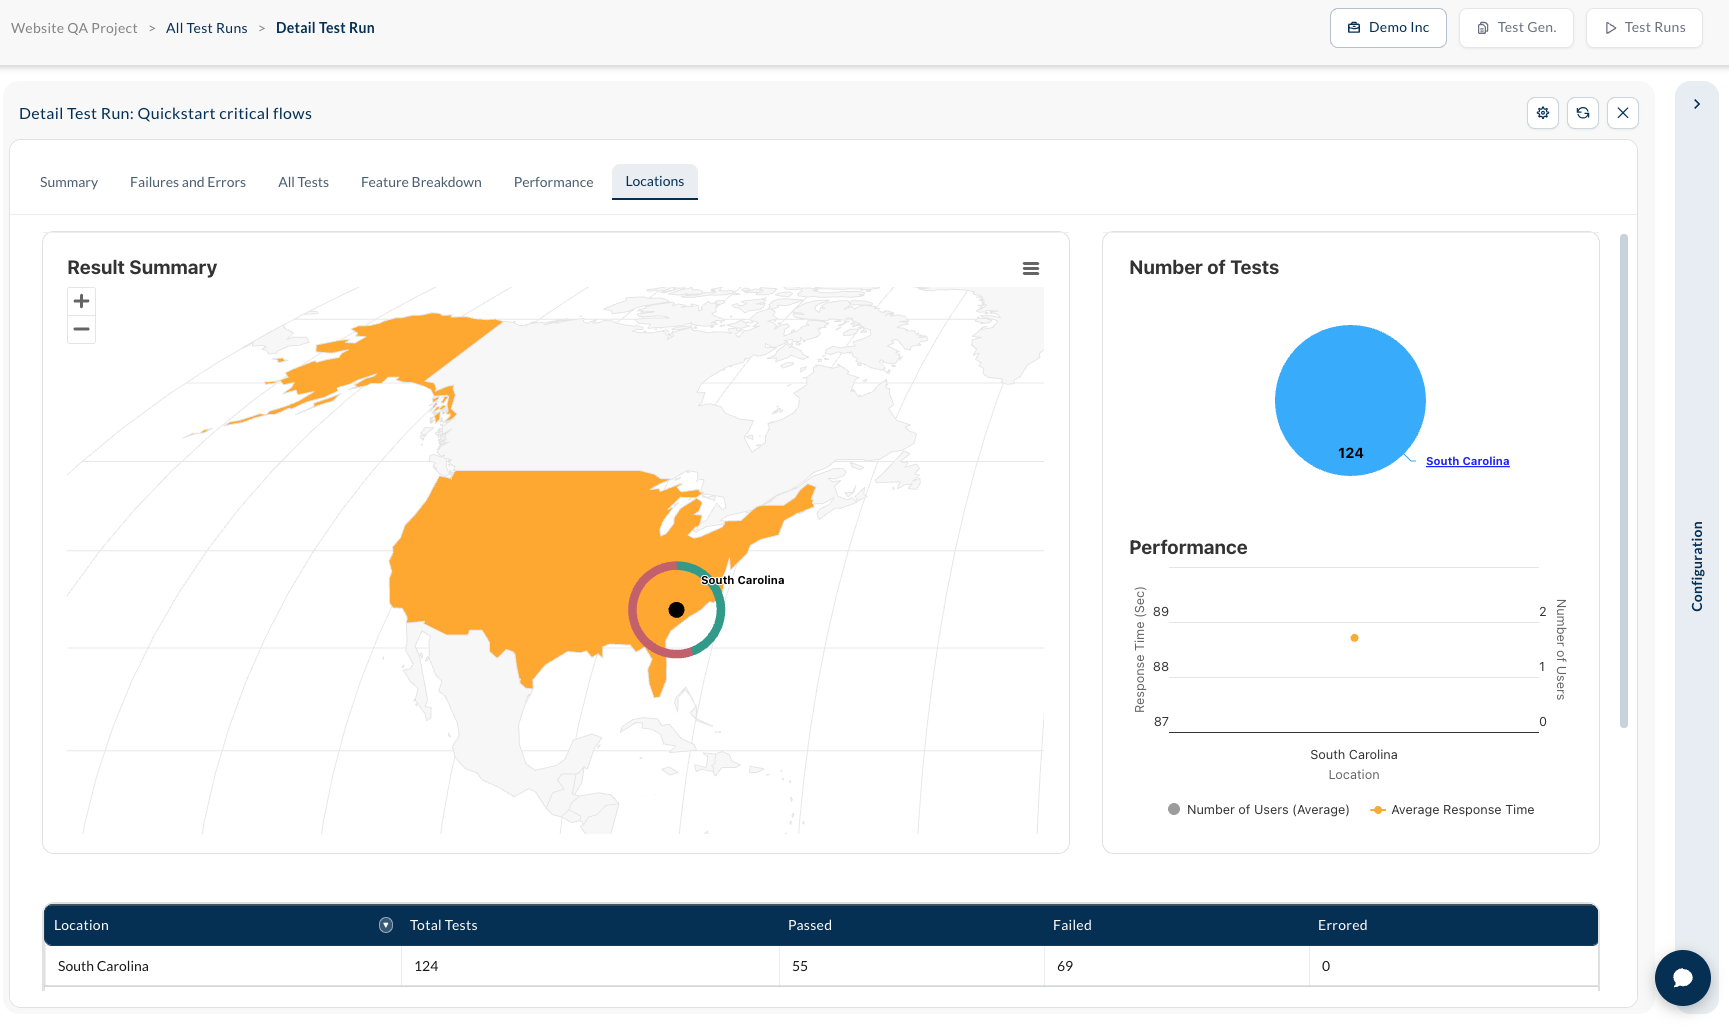
Locations Details Panel
Summarizes the location-based Performance results of a test run including:
- A map of the United States indicating where the tests was run.
- A pie chart for each location showing the status of tests run at that location
- Average response time
- Number of users simulated
- Number of tests by location
For this panel you can configure the following data filters:
- Location
- Browser
These filters help narrow down problem areas.